Why renewables and how do they contribute for Energy Efficiency?

“Energy demand by 2050 could be about the same as in 2015, thanks to significant energy efficiency improvements. The supply mix however, would change substantially, with the share of renewables in total primary energy supply reaching two thirds by 2050“ (IRENA).

What is energy efficiency? It’s simply delivering less energy but providing the same service or even more. The savings will impact not only on the energy consumption but also on the economic side of the matter. Of course, the savings are much more noticeable in large areas than in small ones, but the good news is that we only speak about the differences in amounts and not in concepts.

The second part of the story is renewable energy which is very abstract and needs more precision. According to OECD, “renewable energy is defined as the contribution of renewables to total primary energy supply (TPES)”. This term includes such energy sources as solar, wind, geothermal, hydro, ocean (tide and wave) and biomass (material obtained from living or recently living organisms, for example, wood waste and crops or animal material) to generate electric power. The share of each source of renewable energy is not the same across the world showing large differences. For example, in Latin America, Asia or Africa the use of biomass comes to up to 40% while in EU the maximum use is as high as 10%. In terms of wind energy, the 80% of the total installed wind power capacity of the world is housed by the 8 countries: France, Canada, UK, Spain, India, Germany, USA and China, according to their cumulative installed wind power capacity.

We expect that the contribution of different countries in renewables would not be the same. Let’s see the latest official data available in OECD database of industrialized countries in terms of percentage of primary energy supply from 2000 to 2015 (Figure 1).


Figure 1. Energy Statistics of OECD Countries: Renewable energy as total % of primary energy supply, 2000 – 2015

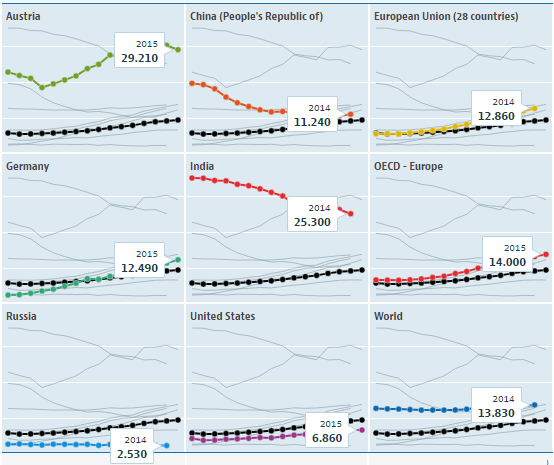
Source: Extended world energy balances, OECD Data. Renewable energy.


All the data are shown individually for each country, such as Australia, China, India, Germany, Russia and USA, and sets of countries such as EU-28, OECD-Europe and World, in comparison with OECD-Total marked in black. The OECD-Total contribution in renewables progressed from 6% of primary energy supply in 2000 to 9,6% in 2015. While we appreciate a significant contribution of some countries – Australia with 29,2% and India with 25,3%, both in 2015 – there is much less contribution although with a rising trend of some others – EU-28 and Germany with approximately 3 points and OECD-Europe with 4,5 points above OECD-Total in 2015. The countries like Russia and USA show their marks below the OECD-Total trend with 2,5% and 6,9% in 2015, respectively. The case of China is different: although its contribution in 2015 is above the OECD-Total mark – 11,2% – the country experienced a sharp decline since 2000 decreasing the renewables output to 77%.

What we cannot forget is the goals that we must meet for 2050 according to the Paris Agreement: the carbon-dioxide emission intensity of the global economy must be reduced by 85%. And this is possible including the renewables into the electric grid more actively. The role of the governments in this case is important, since they “must create the enabling policy framework to spur the acceleration of the transition, including long-term stability for private investments in renewables” (IRENA).

Read more in:

Perspectives for the energy transition

Synergies between renewable energy and energy efficiency

ANA, one of the EiT Project Partners, presented at the Next.Mov, Smart Region Summit in Portugal

ANA Aeroportos de Portugal, one of the partners of the ‘Energy In Time’ Project, took part in the next.mov Smart Region Summit held in Portugal on the 18th and 19th of May, 2017. The Summit was dedicated to highlight the importance of the Mobility and Digital Transformation, the broad topics which include various questions such as energy efficiency, sustainability, smart infrastructure management, decision support tools and others. Within the Summit there were several conferences and showrooms organized to exchange ideas between industry innovation and those who are in charge of governance of regions.

For ANA Aeroportos de Portugal the concepts of mobility and environmental sustainability must be aligned and work coherently: they must involve a set of practices that allow easy access to all airport infrastructures. Mobility and environmental sustainability also refer to the means and good practices that enable the leverage of the social, economic and environmental development in a sustainable manner which is a fundamental commitment of the Portuguese company.

With their presence in the next.mov Smart Region Summit, the EiT Partner tried to demonstrate the practices that allow the citizens to increase their mobility and sustainability of their activity and minimize the consequent impacts while promoting simultaneously full conservation of the surrounding natural resources. Energy efficiency is one of the most important questions mentioned during the summit since its contribution to sustainability is obvious. ANA has much experience in this field since the company has been participating in the European Project Energy in Time (EiT) under which she has developed software tools focused on energy consumption savings in non-residential buildings. Besides that, ANA together with other EiT partners has been testing these tools on the airport of Faro, Portugal, which is one of the demo sites established within the EiT Project.

During the Smart Region Summit, ANA could demonstrate a set of solutions, some of which are already implemented leaving others under research and development, that revealed a strong awareness of the need to develop mobility and sustainability adjusted to the day-to-day management of the airport infrastructures.

The 7th Steering Committee of the Energy In Time Project hold in Cork, Ireland

On 18th of May 2017 the Energy in Time Project hold the 7th and its last Steering Committee, organized by one of the project partners UTRC, to evaluate the current situation and coordinate the future actions to present the final developments. It’s an excellent opportunity to expose all the findings we could obtain through the four demo sites on which we installed different technological solutions as part of the global development. One of the important element is to stress the value that the project offers to the end user which is to control and balance different factors to guarantee the healthy environment inside the building. This involves sustainable energy consumption within the building the results of which are cost savings and emission reduction. The generated information, or aggregated data, constitutes the real value to the final user because it assists in decision making.

Although main results were already achieved, testing is still in progress to compare different patterns. For example, whether temperature and air values reduction contribute to energy saving and at the same time to preserve the user comfort. Some tests demonstrated that it is possible considering that the system was able to detect failures and successfully repair them by itself. Besides that, the air quality was maintained and no additional maintenance was needed. In addition to it, strategies are redefined during the test stage allowing us to precise much more the effort and outputs.

Other important aspects were also presented such as Marketing, Operational and Financial Plans. Through them the EiT Project already identified the main competitors together with specific technological solutions as well as potential customers for each solution and for the global platform. The Operational Plan enables us to meet properly the customer demand and the Financial Plan to evaluate the required effort and returns. Possible scenarios were included to evaluate as really as possible the future growing opportunities.

The final presentation of the Energy In Time Project is planned to be done in September 2017 in Faro, Portugal, where one of the demos sites is located.

The Demo Sites to test the solutions for Energy Efficiency building operation and maintenance

When the technological solution is under development and, especially, when the global solution consists of various systems, it is very important to test them to ensure they work correctly and to obtain the results that justify the efforts related to R&D projects.

In the Energy in Time Project we foresaw the demo sites on which to prove buildings energy demand and consumption since it can be influenced by internal and external factors, such as design, construction materials, climate and users’ behavior, among others. The four demo buildings chosen for such purpose are of different typologies but all of them classified as non-residential. They are located in different climatic zones, that is: in Bucharest (Romania), Faro (Portugal), Helsinki and Levi (Finland). Besides that, since the EiT Project is divided into various modules, the methodologies presented in these modules are applied differently to the assigned demo site.

Here are the most important data about our demo sites.

1. The Airport located in Faro, Portugal

Area Built in Characteristics Methodology used
41.000 m2 1965/1989/2001 (latest refurbishment) Open spaces with big flows of people at certain times of the day, 6 million of passengers daily. Principal energy source: electricity -Optimal Operation Plan Generator for cooling mode.

-Fault Adaptive control for simulation.

-Fault Detection and Diagnostics.

2. Offices and Test Labs Building located in Bucarest, Romania

Area Built in Characteristics Methodology used
17.384 m2 1982 Closed and distributed spaces with constant flows of people and scheduled occupancy. Principal energy source: solar, district heating. -Optimal Operation Plan Generator for heating mode.

-Fault Adaptive control for simulation.

-Fault Detection and Diagnostics.

3. Commercial and Office Building located in Helsinki, Finland

Area Built in Characteristics Methodology used
42.734 m2 1999 Open spaces and distributed spaces with aprox. 1400 of people working daily and scheduled occupancy. Principal energy source: district heating. -Fault Diagnostics implemented to the variable air volume system.

-Fault Adaptive control for simulation.

-Optimal Operation Plan Generator for heating mode.

-Model on demand Control for heating mode.

-Continuous Commissioning methodology.

4. Hotel located in Levi-Lapland, Finland

Area Built in Characteristics Methodology used
42.500 m2 2010 Distributed spaces, seasonal occupation, 170 guest rooms. Principal energy source: district heating. -Optimal Operation Plan Generator for heating mode (decision support).

-Fault Adaptive control for simulation.

-Fault Detection and Diagnostics.

-Predictive Maintenance (the goal is to detect the correct time for maintenance and reduce over-maintentance).

The expected impact is to achieve energy efficiency tangible optimization in buildings. Energy IN TIME goes beyond existing building control techniques and presents an innovative solution for building control and management contributing to building operation energy and maintenance costs with savings of up to 20% over traditional energy consumption. Starburst Casino resides in cyberspace, which is infinite. If you want to take full advantage of every single thing online casino offers, it pays to download Starburst. Thus, we detected the two most important goals, the so-called the ‘W2 goals’ of the EiT solution:

(1) When? That is, ensure energy consumption IN TIME, only when really needed

(2)  What? That is, consume only what is really needed.

The demonstration phase enables us to test function and feasibility of the developed systems, besides energy audit carried out on the demo sites.